Urban Tree Canopy. AKA the urban forest from above.
What is it, why do we measure it, and why does it matter for climate goals?
Author: Alec Sabatini
Alec is the content writer at PlanIT Geo™, a global urban forestry consulting and tree management software firm.
When people talk about urban forests or urban forestry, they mention urban tree canopy - and they mention it soon, and mention it often. I only lasted 12 words before typing it. Point proven? So, what exactly does it mean when we refer to urban tree canopy, and why are cities around the world so focused on tracking it?
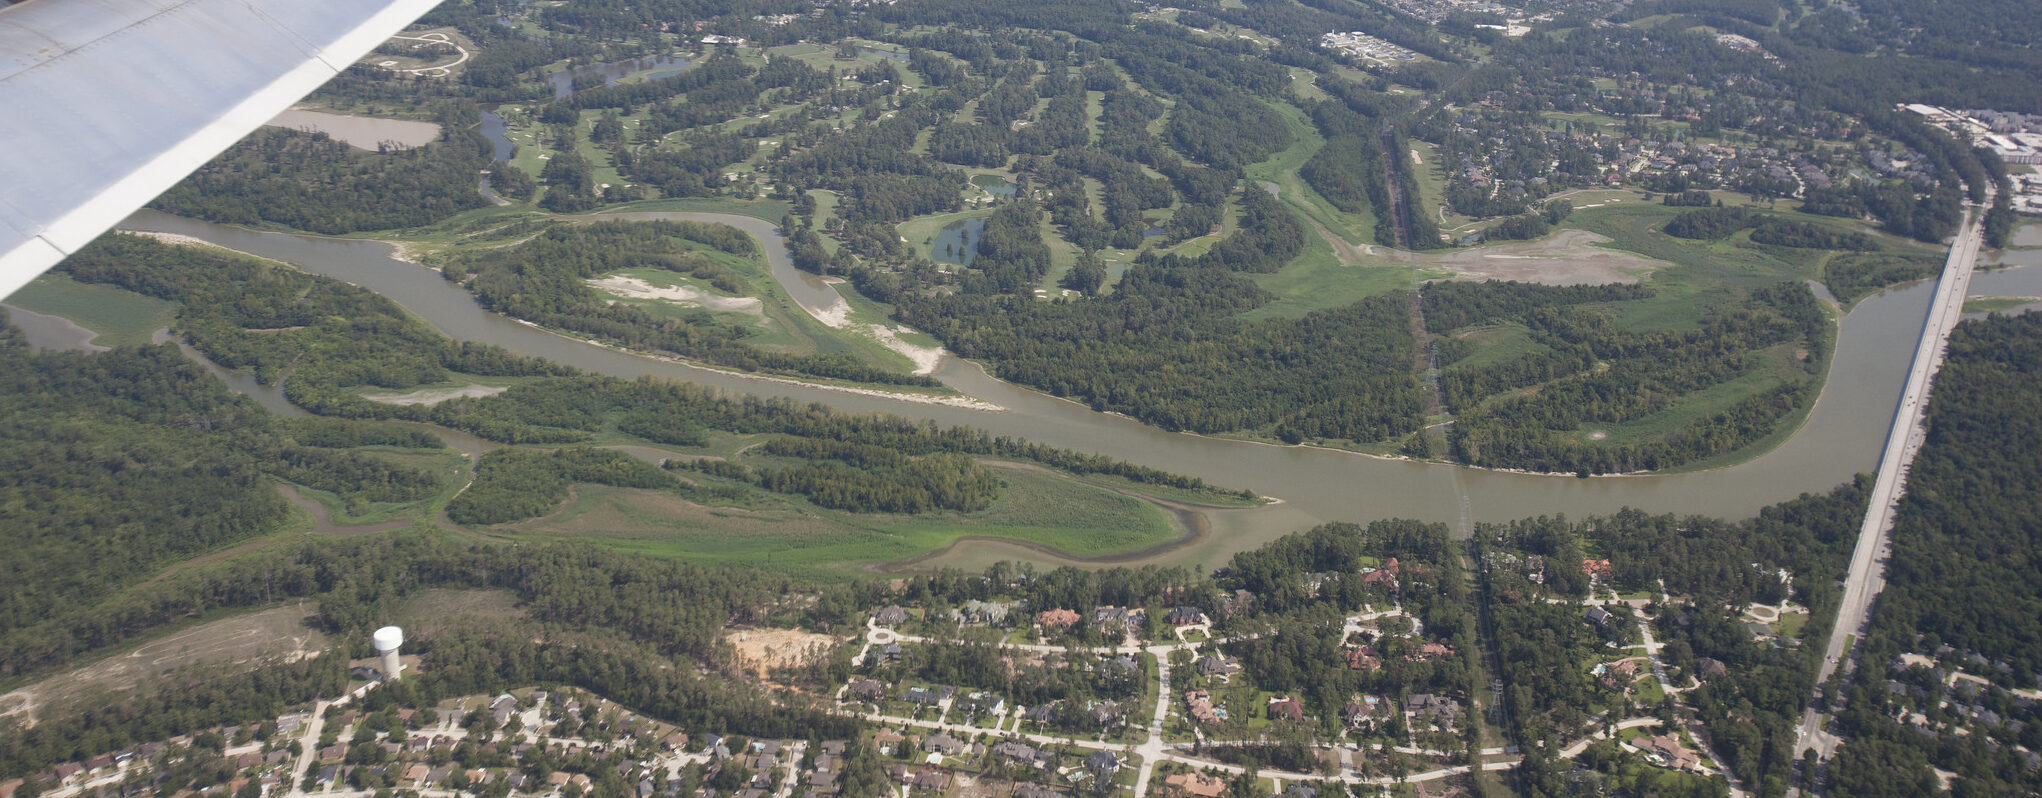
For an individual tree, the canopy refers to the spread of leaves and branches. In the context of urban forestry, the term urban tree canopy refers to the collective canopies of all trees within a defined area, like the city limits. When viewing a city from above it essentially measures how much of that view is covered by green vs. gray assets, such as roads, buildings, or parking lots. There is a careful science to getting this measurement as accurate as possible, one that has been improving in leaps and bounds over the last 20 years.
Picking Plants Out Of Pixels
The process is called an urban tree canopy assessment. Imagery (either from satellites or plane flyovers) is run through a computer analysis to classify each pixel into certain categories. The categories can include tree canopy, non-canopy vegetation (grass, shrubs), open ground, impervious surfaces (buildings, roads), and water (ponds, rivers).
Then other geospatial datasets are blended in to further improve the accuracy. For the purpose of urban forest management, the final product is often simplified down into three types: where trees are, where trees could be, and where trees shouldn’t be (like impervious surfaces or sports fields). For example, an urban tree canopy for Washington, DC found the city was 37% tree canopy, 24% possible planting area, and 39% impervious surfaces
But wait! There’s still a couple layers left on this data onion. Thanks to the census and other surveys there is a ton of socioeconomic information tied to every block and neighborhood in the country. By overlaying tree canopy data on top of demographic data, urban foresters can identify significant trends, such as the disproportionate concentration of canopy in whiter, wealthier neighborhoods (a widespread pattern at the center of the tree equity movement) or the correlation between sparse trees and higher rates of asthma, heart disease, and skin cancer.
Why Measuring Tree Canopy Is So Helpful
There are three chief reasons tree canopy data is invaluable for cities.
- Trees grow, and trees go, and we need to know.
Urban tree canopies are in perpetual motion. Tree growth and regeneration add canopy, while the destructive forces of development, disease, pests, and storms take it away. It’s hard to gauge from the ground, but taking a top-down view allows urban forest managers to track the change of canopy in every nook of the city, including both public and private lands. In fact, for most cities, the majority of their urban forests are on private residential land, so having this comprehensive perspective is vital.
- Invest in the right trees in the right place, for max impact
Maps are a powerful storytelling tool. All of the data points from an urban tree canopy assessment can be combined into a clear, visual story on a map. Urban forest managers use software to map out tree canopy, and then mix in other metrics, such as available planting space and prevalence of urban heat, to develop a priority planting plan


- Data rules. Back it up for the boss and the budget.
Urban forestry departments need to make the most of a limited budget, so it’s crucial to invest their available resources for new trees in the best possible areas.
Frequently, trees and landscaping are treated as an afterthought instead of an essential piece of the urban fabric. “Leadership within community forestry programs will always struggle to get outside agencies to buy into the value of trees without having canopy assessment data,” said Rob Davis, City Forester of Grand Junction, Colorado. Tree canopy data helps urban forest departments build buy-in from government leadership so they can justify their budgets, increase investment in tree planting, and upgrade city policies. Having maps and data that document exactly how tree cover is changing and how it is distributed across a city moves conversations into a discussion of reality instead of hypotheticals.
What’s Your Community’s Canopy Cover?
Find yourself a high vantage point, a plane or hot air balloon, or hop on Google Maps and take a look at your town from above. Try to make a rough estimate of how much of the view is covered by greenery. It’s worth checking to see if your community has completed an urban tree canopy assessment with a quick web search.
There is no magic number all cities should be seeking for canopy coverage. Climate, development pressures, and available space has a huge impact on existing tree canopy. Cities in the Southwest are often in the 5-15% range, while East Coast cities tend towards 30-40%. What is consistent is urban forests and their canopy are a key piece of the puzzle for addressing many of the top challenges facing cities today.